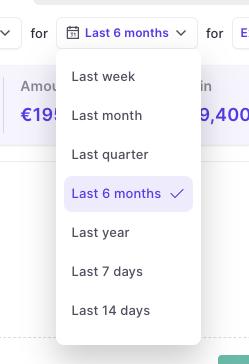
Time ranges and historical data
What is the 'Waterfall' chart good for?
The waterfall chart helps you understand how your pipeline develops over time.
- See the start and end pipeline value
- Click on columns to see what deals are counted towards the total value
- Use the slide-up & sidebar to inspect deals
- Filter by individual rep, a team, or the entire revenue organization
What's the impact of the time range filter?
- The time range narrows down opportunities based on their close date (which you can configure in the forecast settings)
- If the close data of an opportunity is outside of the selected time range, it is also not shown in the Waterfall chart and counted towards the start or end pipeline
Historical data
- By default, Weflow tries to import as much historical data (up to 12 months) after the 'Weflow Managed Package' is installed for the first time
- However, this is limited based on a variety of different factors, such as:
- Field History Tracking
- Custom Fields
- Weflow can only display historical data if it exists in Salesforce
- Unfortunately, Salesforce does not automatically store field changes over time for every field and record meaning there may be limitations in terms of the historical reporting that Weflow can offer to you

